阿里云直播PHP SDK使用方法详解
1、直播云没有单独的SDK,直播部分的SDK是直接封装在CDN的相关的SDK里面
2、针对SDK,没有demo。
3、针对SDK,没有相关的文档说明。
4、针对SDK的说明,网站上面的说明与源码里面的说明完全不一致。
5、针对SDK没有封装那些常用的访问,需要用户组合调用SDK进行拼装,总之一句,这也太抽象,看看人家七牛的API,哎,不多说啥了
6、提供的SDK路径乱的一踏糊涂,想直接用没门,得各种调整。
7、针对SDK基于PHP更高登记的版本,照顾不到一些低版本用户。
针对上面几点原因,踩了一部分坑,参考其他云直播提供的通用接口进行整理的。
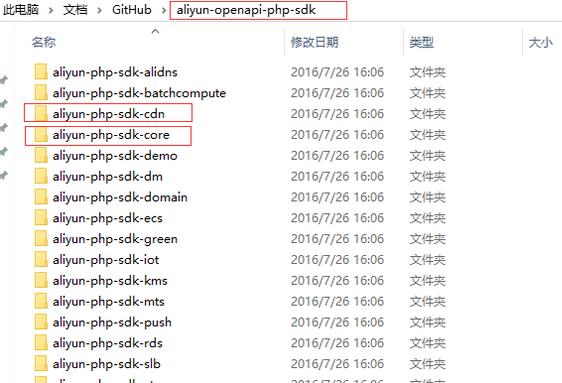
首先,我们分析一下阿里云提供的PHP SDK。阿里云SDK目录结构如下:
aliyun-php-sdk-core:作为PHP SDK引用核心包,只要使用阿里云的产品的php 的SDK,这个文件夹下的所有东东都是基础。
aliyun-php-sdk-cdn:这个包里面是阿里云 CDN产品的PHP SDK,但是目前直播里面的SDK都在这个里面,可能是因为直播产品和CDN产品比较紧密吧!(PS:在开通直播产品时,CDN产品的开通是前提条件)
下图为从阿里云的PHP SDK整个大包,里面包含阿里云所有产品的PHP SDK。
接下下来,我们来看看如何配置,这一步很关键,阿里云的官方网站上面内容 与 SDK 的demo ,有三个版本。(这是痛苦的根源,哈哈)
1、将整个PHP SDK包放置项目目录当中。
2、配置aliyun-php-sdk-core
在aliyun-php-sdk-core下面有一个config.php文件
| 代码如下 | 复制代码 |
|
//config sdk auto load path. //config http proxy
| |
这一句作为核心,表示自动加载aliyun-php-sdk-cdn文件夹下所有的PHP文件。aliyun-php-sdk-cdn是直播服务的SDK,若是想使用阿里云的其他功能,则需要引用其他相关的文件夹。
3、调用直播相关PHP SDK
| 代码如下 | 复制代码 |
|
| |
//初始化直播的具体操作,DescribeLiveRecordConfigRequest是获取直播云下面,所有的创建的app
| 代码如下 | 复制代码 |
|
$request = new Cdn\Request\V20141111\DescribeLiveRecordConfigRequest(); print_r("\r\n");
| |
4、查看数据返回的结果,返回的值是一个对象,里面
| 代码如下 | 复制代码 |
|
[1] => stdClass Object [2] => stdClass Object [3] => stdClass Object [4] => stdClass Object ) ) [RequestId] => 392B879D-2A09-47B3-85CF-627F7BCD3AC1 | |
最近使用 PHP 做了一个服务器负载监控的小东西,在服务器上使用 Workerman 开一个 WebSocket 服务,然后在浏览器中连接到服务。服务每隔 10 秒读取一次主机的相关信息,然后发送给客户端,客户端进行图形化显示。
总体的思路就是使用 PHP 调用 shell 命令,然后解析命令的输出内容。在获取 CPU 负载的时候,遇到了一些小问题。直观来说,直接使用 vmstat 命令就可以获取 CPU 负载,但是实际上,vmstat 命令第一行输出的从主机启动以来的平均 CPU 负载,并不是当前的负载。vmstat 命令还有一些参数,比如可以增加一个延迟参数 delay: vmstat 1,表示每秒输出一次数据,直到用户终止命令:
miroot@miserver:~$ vmstat 1
procs -----------memory---------- ---swap-- -----io---- -system-- ------cpu-----
r b swpd free buff cache si so bi bo in cs us sy id wa st
4 0 0 493644 162940 5727744 0 0 2 15 0 0 1 0 99 0
0 4 0 568392 162952 5656868 0 0 112 15584 8807 4496 29 6 57 7
3 0 0 567152 162952 5657416 0 0 40 116 10104 5164 28 6 65 2
2 1 0 566368 162956 5658476 0 0 84 22220 11126 5632 29 7 58 5
2 2 0 563320 162964 5659200 0 0 56 49240 9765 4792 21 7 53 19
0 0 0 566464 162976 5659892 0 0 80 1212 9998 5135 26 6 59 9
2 0 0 565400 162984 5660736 0 0 92 120 9288 4954 29 5 66 1
^C
miroot@miserver:~$
第一行数据是平均负载,从第二行数据开始,是当前的负载情况。作为监控来讲,肯定更加关注当前的负载情况。
那么,使用 PHP 调用 vmstat,当然不能使用延迟的方式来等待后续行的输出。
查了一些文档,发现在 Linux 上,系统负载的情况在 /proc/stat 这个文件中,这个文件中的内容比较多,所以我们换一个思路,采用 vmstat -s 的方式直接输出内容:
miroot@miserver:~$ vmstat -s
8165768 K total memory
4600664 K used memory
1980464 K active memory
2249908 K inactive memory
3565104 K free memory
232532 K buffer memory
2972048 K swap cache
8378364 K total swap
253352 K used swap
8125012 K free swap
1170373 non-nice user cpu ticks
25184 nice user cpu ticks
294692 system cpu ticks
1309152182 idle cpu ticks
1867039 IO-wait cpu ticks
566 IRQ cpu ticks
76405 softirq cpu ticks
0 stolen cpu ticks
4601555 pages paged in
96400000 pages paged out
1516 pages swapped in
67468 pages swapped out
243751059 interrupts
384963258 CPU context switches
1455419401 boot time
184668 forks
miroot@miserver:~$
可以看到,这里面包含很多和 CPU 相关的数据,实际上这个数据的来源就是 /proc/stat 文件。那么我们关心这么几项数据:
1170373 non-nice user cpu ticks
25184 nice user cpu ticks
294692 system cpu ticks
1309152182 idle cpu ticks
通过 man 5 proc 找到关于 /proc/stat 文件的说明,我们关心的是 CPU 相关数据的说明:
The amount of time, measured in units of USER_HZ (1/100ths of a second on most architectures, use sysconf(_SC_CLK_TCK) to obtain the right value), that the system spent in various states:
user (1) Time spent in user mode.
nice (2) Time spent in user mode with low priority (nice).
system (3) Time spent in system mode.
idle (4) Time spent in the idle task. This value should be USER_HZ times the second entry in the /proc/uptime pseudo-file.
大概的意思就是说,这些数值都是以 USER_HZ 为单位的。不管什么单位,总之他们的单位是一致的,那么我们就可以通过 2 次 vmstat -s 命令的输出来计算每个项上的增量,然后 4 个项上的增量相加就是总体的增量(其实后面还有更多关于 CPU 的数据,我们先忽略掉),然后计算每个项上的增量和总体增量的比,就是在这两次采样之间 CPU 在用户、系统和闲置状态下的负载。
参考代码如下:
// 在 Linux 系统上,需要使用 2 次 vmstat -s
// 结果的差值来计算两次采样之间的 CPU 占用比例
$last_cpu_ticks = array(
0, // non-nice user cpu ticks
0, // nice user cpu ticks
0, // system cpu ticks
0 // idle cpu ticks
);
function _get_cpu_status_linux()
{
global $last_cpu_ticks;
$s = shell_exec('vmstat -s | grep cpu');
if ($s === false) return false;
$lines = explode("n", $s);
if (count($lines) < 4) return false;
$current_data = array();
for ($i = 0; $i < 4; $i++)
{
$current_data[] = (int)(explode(' ', trim($lines[$i]))[0]);
}
$ret = array('user' => 0, 'sys' => 0, 'idle' => 0);
if ($last_cpu_ticks[0] > 0)
{
$total_delta = 0;
foreach ($current_data as $i => $v)
$total_delta += ($v - $last_cpu_ticks[$i]);
$ret['user'] = (int)(($current_data[0] - $last_cpu_ticks[0] + $current_data[1] - $last_cpu_ticks[1]) / $total_delta * 100);
$ret['sys'] = (int)(($current_data[2] - $last_cpu_ticks[2]) / $total_delta * 100);
$ret['idle'] = (int)(($current_data[3] - $last_cpu_ticks[3]) / $total_delta * 100);
}
for ($i = 0; $i < 4; $i++)
$last_cpu_ticks[$i] = $current_data[$i];
return $ret;
}
做一个代码发布的系统,需要用到PHP的exec函数来执行Linux下的命令和git,svn命令,如何判断PHP的exec函数是否执行成功呢?
写个PHP文件来做实验:
exec函数解析
exec语法: string exec(string command, string [array], int [return_var]);
exec返回值: 字符串
Exec参数说明
Command – 需要执行的命令
Array – 是输出值
return_var –是返回值0或1,如果返回0则执行成功,返回1则执行失败。
exec函数第一个参数是执行的命令,第二个参数是执行的结果,第三个参数是执行的状态。
<?php
exec('ls', $log, $status);
print_r($log);
print_r($status);
echo PHP_EOL;
执行这个php文件:
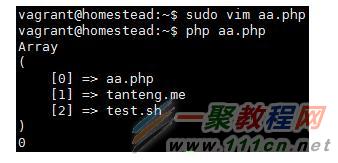
这里$log,$status输出结果如图。
但是$status为0,给人的感觉是执行失败,其实不是,这是exec执行成功。
改一下这个php文件,给exec第一个参数一个错误的命令。
如:exec(‘lsaa’,$log,$status).
再次执行,运行结果如图:
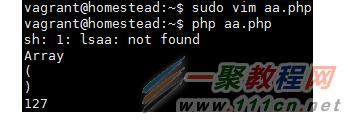
这里$status确是有值的。
那么证明$status为0的时候表示exec执行是成功的。这里PHP官方手册上并没有明确说明。
最终这个执行命令的方法如下:
PHP exec执行命令PHP
public function runLocalCommand($command) {
$command = trim($command);
$status = 1;
$log = '';
exec($command . ' 2>&1', $log, $status);
// 执行过的命令
$this->command = $command;
// 执行的状态
$this->status = !$status;
return $this->status;
}
去除了日志记录和其他的判断。
注意这里:
$this->status = !$status;
返回状态的时候取相反的值!
什么是opcode
也许你曾经尝试过用C/C++编写动态内容,虽然开发过程极其繁琐,但为了获得性能提升,这样做或许是值得的,它们可以将动态内容编译成二进制可执行文件,也就是目标代码,由操作系统进程直接装载运行。如今已经很少有人使用C/C++编写动态内容了,绝大多数的Web开发人员享受着当下的幸福时光,很多优秀的脚本语言可供选择,比如PHP,Ruby,Python,它们都属于解释型语言,所以用它们编写的动态内容都需要依赖响应的解释器程序来运行。
解释器程序也是一个二进制可执行文件,比如/bin/ruby,它同样可以直接在进程中运行,在运行过程中,解释器程序需要对输入的脚本代码进行分析,领会它们的旨意,然后执行它们。比如下面我们调用PHP的解释器,让它执行一段简单的脚本代码:
~ zfs$ php -r 'print 1+1;'
2
很好,它很快的输出了正确的结果,也许你觉的1+1的计算太小儿科,的确,在人类的大脑中计算1+1是很简单,几乎不用思考,但解释器的工作方式可不是你想象的那样,1+1和100+1000对它来说几乎没有什么区别,因为解释器核心引擎根本看不懂这些脚本代码,无法直接执行,所以需要进行一系列的代码分析工作,当解释器完成对脚本代码的分析后,便将它们生成可以直接运行的中间代码,也称为操作码(Operate Code,opcode)。
从程序代码到中间代码的这个过程,我们称为解释(parse),它由解释器来完成。如此相似的是,编译型语言中的编译器(如C语言的编译器gcc),也要将程序代码生成中间代码,这个过程我们称为编译(compile)。编译器和解释器的一个本质不同在于,解释器在生成中间代码后,便直接执行它,所以运行时的控制权在解释器;而编译器则将中间代码进一步优化,生成可以直接运行的目标程序,但不执行它,用户可以在随后的任意时间执行它,这时的控制权在目标程序,和编译器没有任何关系。
事实上,就解释和编译本身而言,它们的原理是相似的,都包括词法分析,语法分析,语义分析等,所以,有些时候将解释型语言中生成opcode的过程也称为"编译",需要你根据上下文来理解。
那么,opcode究竟是什么样的呢? 它又是如何解释生成的呢? 我们以PHP为例,来寻找这些答案。
PHP解释器的核心引擎为Zend Engine,可以很容易的查看它的版本:
~ zfs$ php -v
PHP 5.5.14 (cli) (built: Sep 9 2014 19:09:25)
Copyright (c) 1997-2014 The PHP Group
Zend Engine v2.5.0, Copyright (c) 1998-2014 Zend Technologies
还记得前面我们曾经用PHP计算1+1的脚本代码吗? 我们来看看这段代码的opcode。在此之前,需要安装PHP的Parsekit扩展,它是一个用C编写的二进制扩展,由PECL来维护。有了Parsekit扩展后,我们就可以通过它提供的运行时API来查看任何PHP文件或者代码段的opcode。我们直接在命令行中调用parsekit_compile_string(),如下所示:
/usr/local/php/bin/php -r "var_dump(parsekit_compile_string('print 1+1;'));"
这样一来,我们便获得了这段代码的opcode,返回的是数组形式,结果如下所示:
array(20) {
["type"]=>
int(4)
["type_name"]=>
string(14) "ZEND_EVAL_CODE"
["fn_flags"]=>
int(0)
["num_args"]=>
int(0)
["required_num_args"]=>
int(0)
["pass_rest_by_reference"]=>
bool(false)
["uses_this"]=>
bool(false)
["line_start"]=>
int(0)
["line_end"]=>
int(0)
["return_reference"]=>
bool(false)
["refcount"]=>
int(1)
["last"]=>
int(5)
["size"]=>
int(5)
["T"]=>
int(2)
["last_brk_cont"]=>
int(0)
["current_brk_cont"]=>
int(4294967295)
["backpatch_count"]=>
int(0)
["done_pass_two"]=>
bool(true)
["filename"]=>
string(17) "Parsekit Compiler"
["opcodes"]=>
array(5) {
[0]=>
array(8) {
["address"]=>
int(33847532)
["opcode"]=>
int(1)
["opcode_name"]=>
string(8) "ZEND_ADD"
["flags"]=>
int(197378)
["result"]=>
array(3) {
["type"]=>
int(2)
["type_name"]=>
string(10) "IS_TMP_VAR"
["var"]=>
int(0)
}
["op1"]=>
array(3) {
["type"]=>
int(1)
["type_name"]=>
string(8) "IS_CONST"
["constant"]=>
&int(1)
}
["op2"]=>
array(3) {
["type"]=>
int(1)
["type_name"]=>
string(8) "IS_CONST"
["constant"]=>
&int(1)
}
["lineno"]=>
int(1)
}
[1]=>
array(7) {
["address"]=>
int(33847652)
["opcode"]=>
int(41)
["opcode_name"]=>
string(10) "ZEND_PRINT"
["flags"]=>
int(770)
["result"]=>
array(3) {
["type"]=>
int(2)
["type_name"]=>
string(10) "IS_TMP_VAR"
["var"]=>
int(1)
}
["op1"]=>
array(3) {
["type"]=>
int(2)
["type_name"]=>
string(10) "IS_TMP_VAR"
["var"]=>
int(0)
}
["lineno"]=>
int(1)
}
[2]=>
array(7) {
["address"]=>
int(33847772)
["opcode"]=>
int(70)
["opcode_name"]=>
string(9) "ZEND_FREE"
["flags"]=>
int(271104)
["op1"]=>
array(4) {
["type"]=>
int(2)
["type_name"]=>
string(10) "IS_TMP_VAR"
["var"]=>
int(1)
["EA.type"]=>
int(0)
}
["op2"]=>
array(3) {
["type"]=>
int(8)
["type_name"]=>
string(9) "IS_UNUSED"
["opline_num"]=>
string(1) "0"
}
["lineno"]=>
int(1)
}
[3]=>
array(7) {
["address"]=>
int(33847892)
["opcode"]=>
int(62)
["opcode_name"]=>
string(11) "ZEND_RETURN"
["flags"]=>
int(16777984)
["op1"]=>
array(3) {
["type"]=>
int(1)
["type_name"]=>
string(8) "IS_CONST"
["constant"]=>
&NULL
}
["extended_value"]=>
int(0)
["lineno"]=>
int(1)
}
[4]=>
array(5) {
["address"]=>
int(33848012)
["opcode"]=>
int(149)
["opcode_name"]=>
string(21) "ZEND_HANDLE_EXCEPTION"
["flags"]=>
int(0)
["lineno"]=>
int(1)
}
}
}
parsekit扩展的安装请参见这篇文章
系统缓存
它是指APC把PHP文件源码的编译结果缓存起来,然后在每次调用时先对比时间标记。如果未过期,则使用缓存的中间代码运行。默认缓存3600s(一小时)。但是这样仍会浪费大量CPU时间。因此可以在php.ini中设置system缓存为永不过期(apc.ttl=0)。不过如果这样设置,改运php代码后需要重启WEB服务器。目前使用较多的是指此类缓存。
用户数据缓存
缓存由用户在编写PHP代码时用apc_store和apc_fetch函数操作读取、写入的。如果数据量不大的话,可以一试。如果数据量大,使用类似memcache此类的更加专著的内存缓存方案会更好。
APC模块的安装
最简单的方法是直接使用pecl,在命令行下输入:/usr/local/php/bin/pecl install apc
然后按照提示一步步完成即可,示例如下:
[root@iZ23bm1tc0pZ ~]# /usr/local/php/bin/pecl install apc
downloading APC-3.1.13.tgz ...
Starting to download APC-3.1.13.tgz (171,591 bytes)
.....................................done: 171,591 bytes
55 source files, building
running: phpize
Configuring for:
PHP Api Version: 20100412
Zend Module Api No: 20100525
Zend Extension Api No: 220100525
Enable internal debugging in APC [no] : no
Enable per request file info about files used from the APC cache [no] : no
Enable spin locks (EXPERIMENTAL) [no] : no
Enable memory protection (EXPERIMENTAL) [no] : no
Enable pthread mutexes (default) [no] : no
Enable pthread read/write locks (EXPERIMENTAL) [yes] : yes
然后重启服务器即可:
lnmp nginx restart
先看一下没有使用apc情况下的压测结果:
[root@iZ23bm1tc0pZ ~]# ab -n1000 -c100 http://zfsphp.cn/index.php
This is ApacheBench, Version 2.3 <$Revision: 1706008 $>
Copyright 1996 Adam Twiss, Zeus Technology Ltd, http://www.zeustech.net/
Licensed to The Apache Software Foundation, http://www.apache.org/
Benchmarking zfsphp.cn (be patient)
Completed 100 requests
Completed 200 requests
Completed 300 requests
Completed 400 requests
Completed 500 requests
Completed 600 requests
Completed 700 requests
Completed 800 requests
Completed 900 requests
Completed 1000 requests
Finished 1000 requests
Server Software: nginx
Server Hostname: zfsphp.cn
Server Port: 80
Document Path: /index.php
Document Length: 14341 bytes
Concurrency Level: 100
Time taken for tests: 15.517 seconds
Complete requests: 1000
Failed requests: 0
Total transferred: 14544000 bytes
HTML transferred: 14341000 bytes
Requests per second: 64.45 [#/sec] (mean)
Time per request: 1551.671 [ms] (mean)
Time per request: 15.517 [ms] (mean, across all concurrent requests)
Transfer rate: 915.34 [Kbytes/sec] received
Connection Times (ms)
min mean[+/-sd] median max
Connect: 0 2 4.8 0 17
Processing: 46 1481 277.0 1560 1638
Waiting: 42 1481 277.1 1560 1638
Total: 58 1482 272.8 1560 1638
Percentage of the requests served within a certain time (ms)
50% 1560
66% 1576
75% 1582
80% 1587
90% 1602
95% 1612
98% 1622
99% 1629
100% 1638 (longest request)
可见最大吞吐率只有64.45reqs/s
然后我们开启apc,测试结果如下:
[root@iZ23bm1tc0pZ ~]# ab -n1000 -c100 http://zfsphp.cn/index.php
This is ApacheBench, Version 2.3 <$Revision: 1706008 $>
Copyright 1996 Adam Twiss, Zeus Technology Ltd, http://www.zeustech.net/
Licensed to The Apache Software Foundation, http://www.apache.org/
Benchmarking zfsphp.cn (be patient)
Completed 100 requests
Completed 200 requests
Completed 300 requests
Completed 400 requests
Completed 500 requests
Completed 600 requests
Completed 700 requests
Completed 800 requests
Completed 900 requests
Completed 1000 requests
Finished 1000 requests
Server Software: nginx
Server Hostname: zfsphp.cn
Server Port: 80
Document Path: /index.php
Document Length: 14341 bytes
Concurrency Level: 100
Time taken for tests: 7.122 seconds
Complete requests: 1000
Failed requests: 0
Total transferred: 14544000 bytes
HTML transferred: 14341000 bytes
Requests per second: 140.41 [#/sec] (mean)
Time per request: 712.189 [ms] (mean)
Time per request: 7.122 [ms] (mean, across all concurrent requests)
Transfer rate: 1994.29 [Kbytes/sec] received
Connection Times (ms)
min mean[+/-sd] median max
Connect: 0 1 2.4 0 10
Processing: 23 677 125.3 705 775
Waiting: 22 677 125.4 705 775
Total: 30 678 123.1 705 775
Percentage of the requests served within a certain time (ms)
50% 705
66% 719
75% 726
80% 730
90% 742
95% 750
98% 760
99% 765
100% 775 (longest request)
可见吞吐率提高了一倍多,达到140.41reqs/s。
然后,我们在开启动态内容缓存(楼主的博客用的是Smarty缓存),测试结果如下:
[root@iZ23bm1tc0pZ ~]# ab -n1000 -c100 http://zfsphp.cn/index.php
This is ApacheBench, Version 2.3 <$Revision: 1706008 $>
Copyright 1996 Adam Twiss, Zeus Technology Ltd, http://www.zeustech.net/
Licensed to The Apache Software Foundation, http://www.apache.org/
Benchmarking zfsphp.cn (be patient)
Completed 100 requests
Completed 200 requests
Completed 300 requests
Completed 400 requests
Completed 500 requests
Completed 600 requests
Completed 700 requests
Completed 800 requests
Completed 900 requests
Completed 1000 requests
Finished 1000 requests
Server Software: nginx
Server Hostname: zfsphp.cn
Server Port: 80
Document Path: /index.php
Document Length: 14341 bytes
Concurrency Level: 100
Time taken for tests: 2.263 seconds
Complete requests: 1000
Failed requests: 0
Total transferred: 14544000 bytes
HTML transferred: 14341000 bytes
Requests per second: 441.98 [#/sec] (mean)
Time per request: 226.255 [ms] (mean)
Time per request: 2.263 [ms] (mean, across all concurrent requests)
Transfer rate: 6277.49 [Kbytes/sec] received
Connection Times (ms)
min mean[+/-sd] median max
Connect: 0 1 3.1 0 12
Processing: 18 215 38.1 222 255
Waiting: 18 215 38.3 222 255
Total: 26 216 35.6 223 255
Percentage of the requests served within a certain time (ms)
50% 223
66% 230
75% 232
80% 234
90% 237
95% 239
98% 240
99% 243
100% 255 (longest request)
这一次吞吐率居然达到441.98reqs/s,提高了三倍多,相比最初的64.45reqs/s提高了近7倍,可见使用apc的opcode缓存配合Smarty缓存,对网站性能的优化效果还是相当明显的。
相关文章
php 中file_get_contents超时问题的解决方法
file_get_contents超时我知道最多的原因就是你机器访问远程机器过慢,导致php脚本超时了,但也有其它很多原因,下面我来总结file_get_contents超时问题的解决方法总结。...2016-11-25- 有时为了网站安全和版权问题,会对自己写的php源码进行加密,在php加密技术上最常用的是zend公司的zend guard 加密软件,现在我们来图文讲解一下。 下面就简单说说如何...2016-11-25
- 相信很多站长都遇到过这样一个问题,访问页面时出现408错误,下面一聚教程网将为大家介绍408错误出现的原因以及408错误的解决办法。 HTTP 408错误出现原因: HTT...2017-01-22
- php如何实现抓取网页图片,相较于手动的粘贴复制,使用小程序要方便快捷多了,喜欢编程的人总会喜欢制作一些简单有用的小软件,最近就参考了网上一个php抓取图片代码,封装了一个php远程抓取图片的类,测试了一下,效果还不错分享...2015-10-30
- 下面我们来看一篇关于Android子控件超出父控件的范围显示出来方法,希望这篇文章能够帮助到各位朋友,有碰到此问题的朋友可以进来看看哦。 <RelativeLayout xmlns:an...2016-10-02
- ps软件是现在很多人都会使用到的,HSL面板在ps软件中又有着非常独特的作用。这次文章就给大家介绍下ps怎么使用HSL面板,还不知道使用方法的下面一起来看看。  ...2017-07-06
- ps软件是现在非常受大家喜欢的一款软件,有着非常不错的使用功能。这次文章就给大家介绍下ps把文字背景变透明的操作方法,喜欢的一起来看看。 1、使用Photoshop软件...2017-07-06
intellij idea快速查看当前类中的所有方法(推荐)
这篇文章主要介绍了intellij idea快速查看当前类中的所有方法,本文通过实例代码给大家介绍的非常详细,对大家的学习或工作具有一定的参考借鉴价值,需要的朋友可以参考下...2020-09-02- 1.在没有设置默认值的情况下: 复制代码 代码如下:SELECT userinfo.id, user_name, role, adm_regionid, region_name , create_timeFROM userinfoLEFT JOIN region ON userinfo.adm_regionid = region.id 结果:...2014-05-31
js导出table数据到excel即导出为EXCEL文档的方法
复制代码 代码如下: <!DOCTYPE html PUBLIC "-//W3C//DTD XHTML 1.0 Transitional//EN" "http://www.w3.org/TR/xhtml1/DTD/xhtml1-transitional.dtd"> <html xmlns="http://www.w3.org/1999/xhtml"> <head> <meta ht...2013-10-13- 批量更新mysql更新语句很简单,更新一条数据的某个字段,一般这样写:复制代码 代码如下:UPDATE mytable SET myfield = 'value' WHERE other_field = 'other_value';如果更新同一字段为同一个值,mysql也很简单,修改下where即...2013-10-04
- 许多的朋友对于Plesk控制面板应用不是非常的了解特别是英文版的Plesk控制面板,在这里小编整理了一些关于Plesk控制面板常用的使用方案整理,具体如下。 本文基于Linu...2016-10-10
- ps软件是一款非常不错的图片处理软件,有着非常不错的使用效果。这次文章要给大家介绍的是ps怎么制作倒影,一起来看看设计倒影的方法。 用ps怎么做倒影最终效果̳...2017-07-06
- 本文涉及的主题虽然很基础,在许多人看来属于小伎俩,但在JavaScript基础知识中属于一个综合性的话题。这里会涉及到对象属性的封装、原型、构造函数、闭包以及立即执行表达式等知识。公有方法 公有方法就是能被外部访问...2015-11-08
安卓手机wifi打不开修复教程,安卓手机wifi打不开解决方法
手机wifi打不开?让小编来告诉你如何解决。还不知道的朋友快来看看。 手机wifi是现在生活中最常用的手机功能,但是遇到手机wifi打不开的情况该怎么办呢?如果手机wifi...2016-12-21- 最近想自学PHP ,做了个验证码,但不知道怎么搞的,总出现一个如下图的小红叉,但验证码就是显示不出来,原因如下 未修改之前,出现如下错误; (1)修改步骤如下,原因如下,原因是apache权限没开, (2)点击打开php.int., 搜索extension=ph...2013-10-04
使用insertAfter()方法在现有元素后添加一个新元素
复制代码 代码如下: //在现有元素后添加一个新元素 function insertAfter(newElement, targetElement){ var parent = targetElement.parentNode; if (parent.lastChild == targetElement){ parent.appendChild(newEl...2014-05-31- 单个字符分割 string s="abcdeabcdeabcde"; string[] sArray=s.Split('c'); foreach(string i in sArray) Console.WriteLine(i.ToString()); 输出下面的结果: ab de...2020-06-25
使用percona-toolkit操作MySQL的实用命令小结
1.pt-archiver 功能介绍: 将mysql数据库中表的记录归档到另外一个表或者文件 用法介绍: pt-archiver [OPTION...] --source DSN --where WHERE 这个工具只是归档旧的数据,不会对线上数据的OLTP查询造成太大影响,你可以将...2015-11-24- 大概有如下步骤 新建项目Bejs 新建文件package.json 新建文件Gruntfile.js 命令行执行grunt任务 一、新建项目Bejs源码放在src下,该目录有两个js文件,selector.js和ajax.js。编译后代码放在dest,这个grunt会...2014-06-07